Technical Overview
DSM Suite Components
The DSM suite consists of the following components:
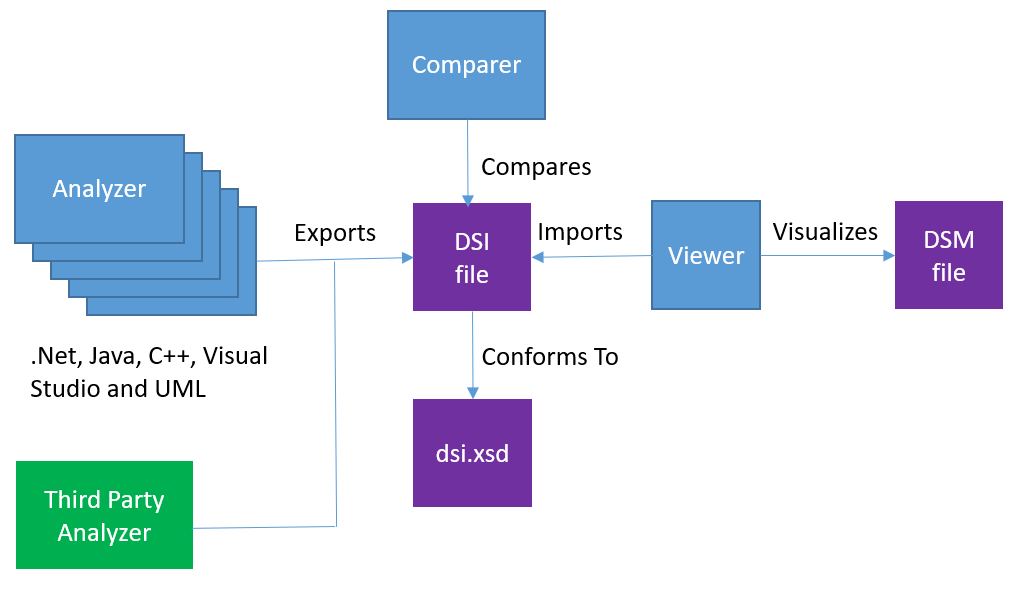
Figure 9: DSM Suite Key Components
Analyzer
An analyzer, which extracts information on elements and their relations from source, binaries or other data. An analyzer exports this information to a DSI file.
A few standard analyzers are provided. If none of the provided analyzers suites your needs, it is possible to write your own analyzer as long as its writes the result to a DSI file.
The DSI file must conform to the XSD schema described below. The DSM file format can be changed without any notice.
Comparer
Can compare two DSI files and reports the deltas.
DSM Viewer
The DSI file can be directly imported by the DSM viewer and can then visualizes the element hierarchy and dependencies. The DSM viewer saves its model as a DSM file. The DSM viewer supports editing models for impact analysis.
The DSI file format
Each analyzer must export its results to DSI file. To ensure that the DSM viewer can import this file, it must conform the DSI file XSD schema below:
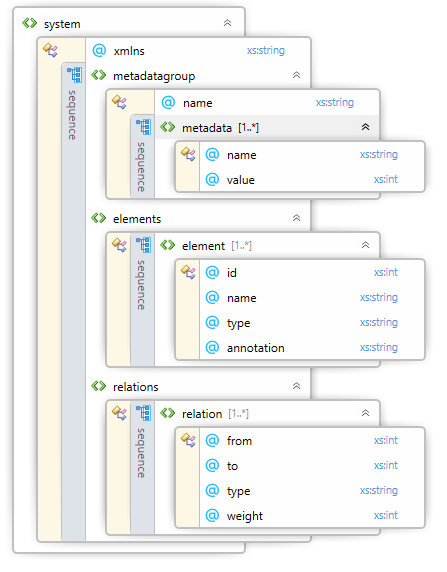
Each element has the following attributes:
| Name | Description |
|---|---|
| id | An unique integer value defining the element. |
| name | An unique name of the element. The name consists of dot separated elements. Each element represents a part in a element hierarchy e.g. a directory or a namespace. |
| type | The type of element e.g. class, enum of file. |
| annotation | Additional information about the element. |
Each relation has the following attributes:
| Name | Description |
|---|---|
| from | The id of the provider element. |
| to | The id of the consumer element. |
| type | The type of relation e.g. include, inherit, realize. |
| weight | The strength of the relation. |
File compression
Both DSI and DSM files can be written as a compressed file or as plain xml. Compression can be used to reduce file size. Upon reading the tooling automatically detects if a file is compressed, so no separate extension is used for the compressed format. The used compression is the zip format.
Installation
Download the installer and install whatever best suits your needs.
See downloads
Analyzing Code
Follow the detailed instruction of the selected analyzer:
| Name | Instruction |
|---|---|
| .Net analyzer | Analyzing .Net code |
| Java analyzer | Analyzing Java code |
| C++ analyzer | Analyzing C/C++ code |
| Visual Studio analyzer | Analyzing VC++ projects |
| UML analyzer | Analyzing Sparx System EA UML models |
The analyzers support the following log levels:
| Level | Description |
|---|---|
| None | Nothing is logged |
| User | User messages are logged to a file |
| Warning | Warnings messages are logged to a file |
| Error | Errors messages are logged to a file |
| Info | Info message are logged to a file |
| Data | Data model actions are logged to a file |
| All | Detailed information is logged to file |
Each log level also includes logging of all previous log levels. Exceptions and user message are always written to the console independent of the selected log level.
Standard the following log files can be generated:
| Level | Log file | Description |
|---|---|---|
| User | userMessages.log | Contains all messages as shown in the console. |
| Error | errorMessages.log | Contains error messages. |
| Error | exceptions.log | Contains information about any exceptions that occured during the analysis. |
| Warning | warningMessages.log | Contains warnings messages. |
| User | infoMessages.log | Contains information messages. |
| Data | dataModelActions.log | Contains all actions on the data model like load, save and registration. |
| dataModelRelationsNotResolved.log | Contains queried relations that could not be resolved. |
For each level an analyzer may add additional log files. Details can be found in the documentation for that analyzer.
Comparing Models
Two DSI model files can be compared as follows:
C:\Program Files\DsmSuite\Comparer\DsmSuite.Analyzer.Compare.exe oldfile.xml newfile.dsi
The compare tool reports added/removed elements and relations.
Viewing and Editing Models
The DSI file can be directly imported into the DSM viewer.
The viewer has the following features:
Model navigation
The tool will show the element hierarchy and dependencies between the elements. The hovered and selected element or cell are highlighted.
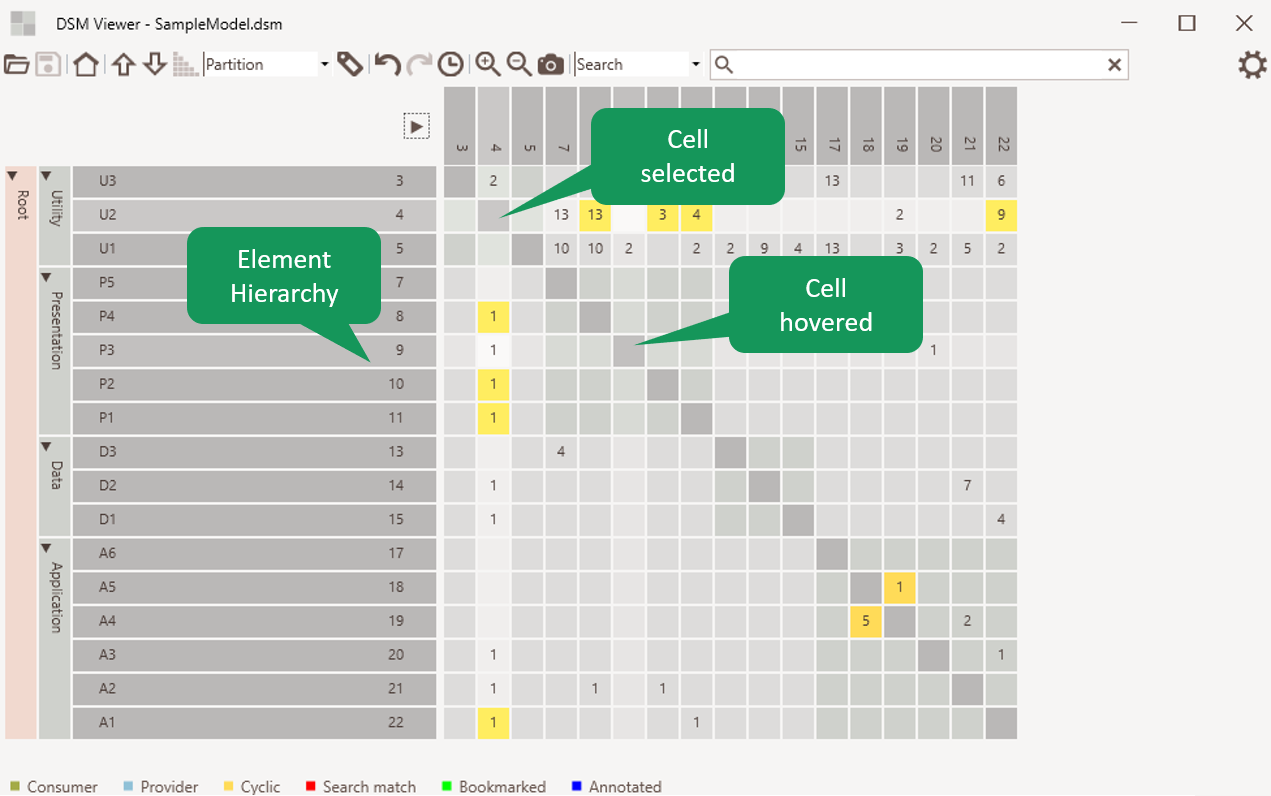
Figure 1: Model navigation
Dependency visualization
It will show the dependency strength in the matrix. Cycles will be highlighted. Consumers and providers of the selected element are highlighted as well if the element indicator view mode is ‘default’.
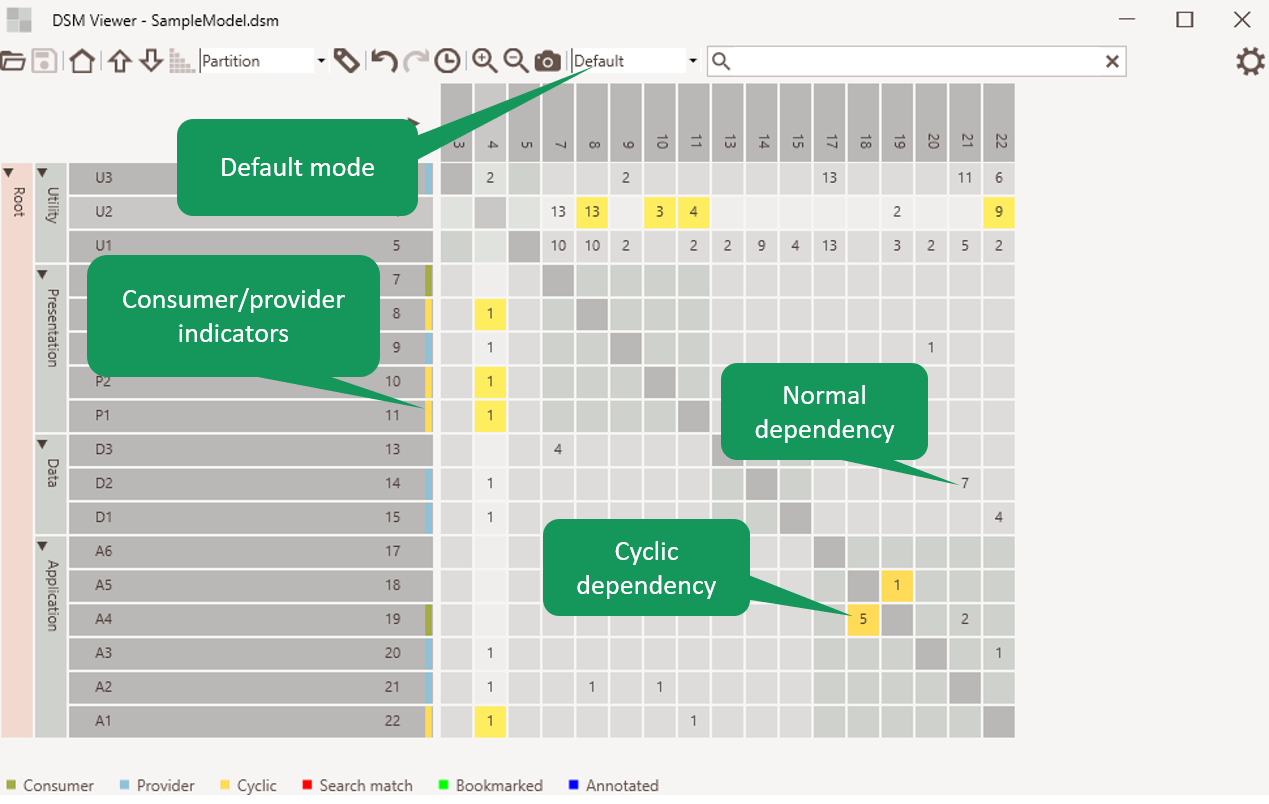
Figure 2: Dependency visualization
Element search
It allows searching for elements by name or part of the name. The number of found elements is indicated. In the matrix elements containing the found elements are highlighted so it is easy to navigate to the found elements.
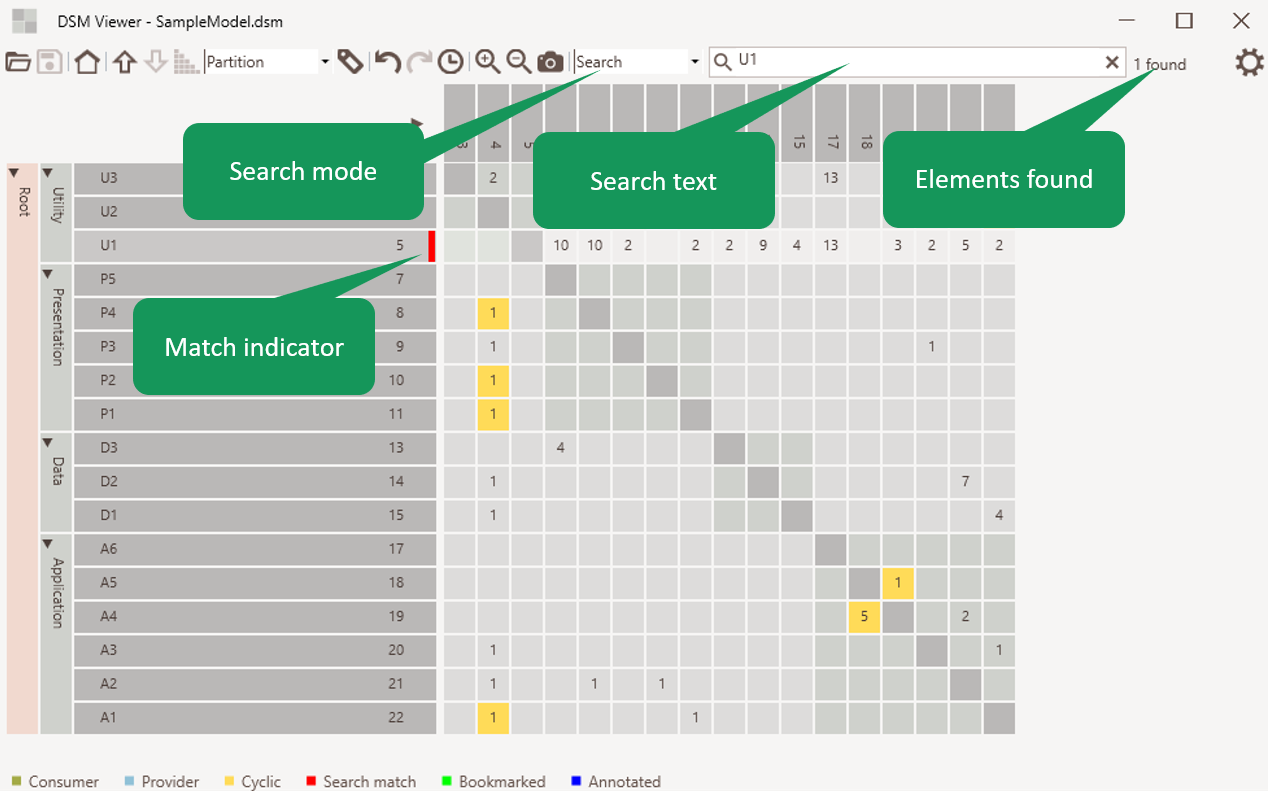
Figure 3: Element search
Element bookmarking
It allows bookmarking of elements. Bookmarks can only be edited when the element indicator view mode is ‘bookmarks’.
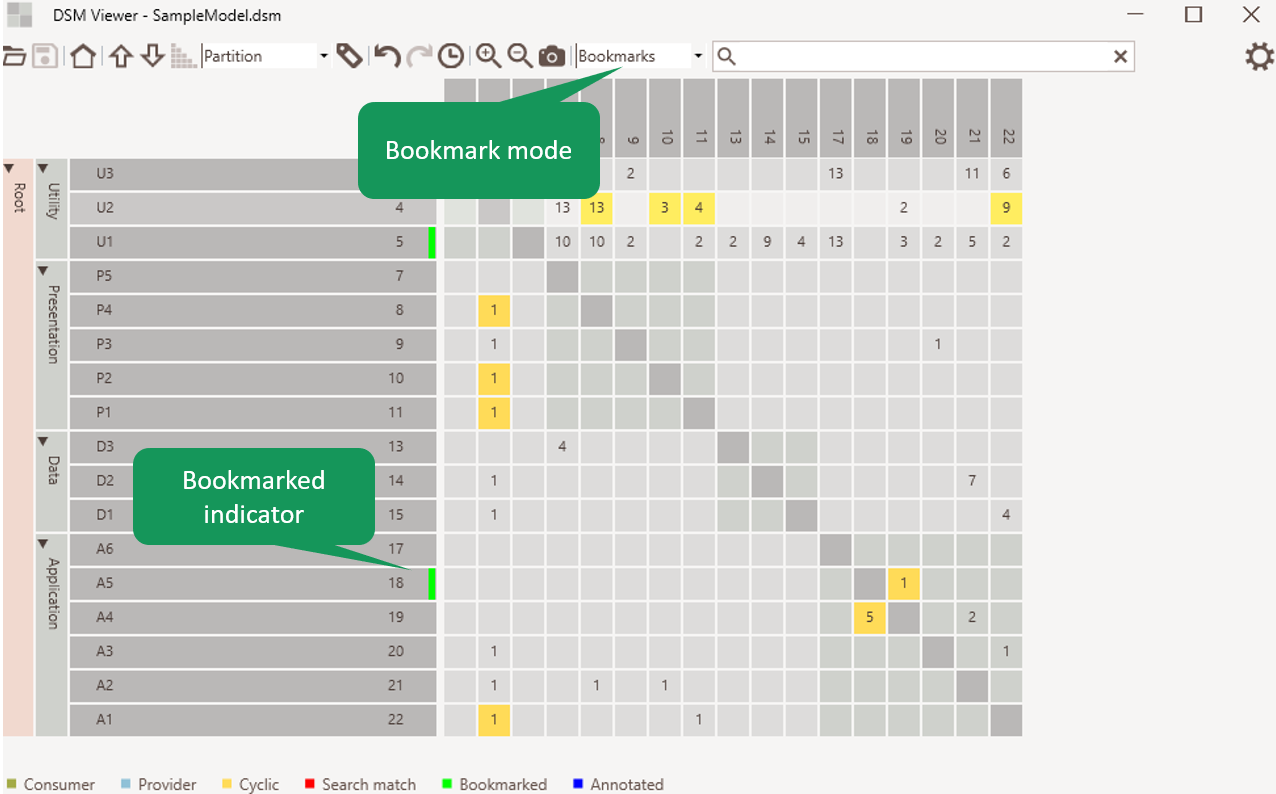
Figure 4: Element bookmarking
Element annotation
It allows adding annotations to elements. Annotations can only be edited when the element indicator view mode is ‘annotations’. Annotations are shown in the element tooltip.
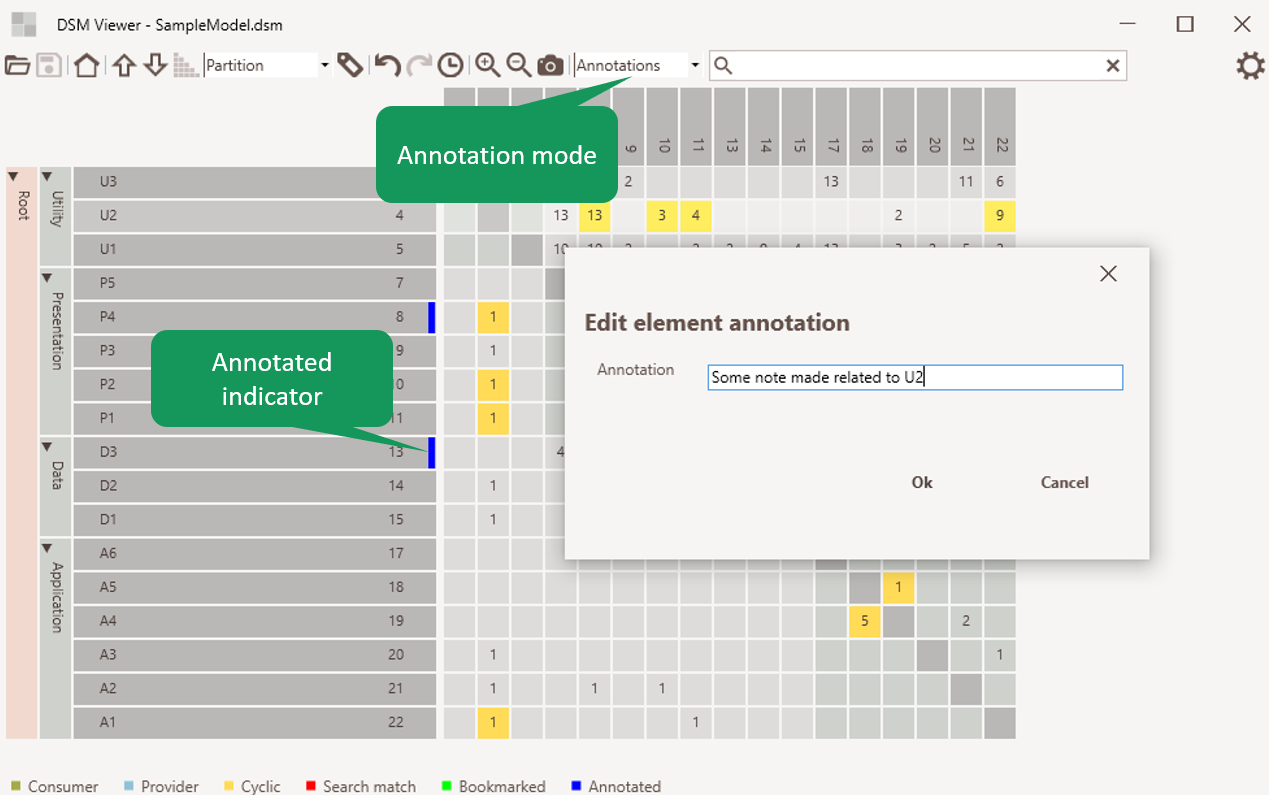
Figure 5: Element annotation
Metrics
The metrics cab show several sort of metricss. It can be expanded/collapsed and will show metrics per element. Several metrics are supported.
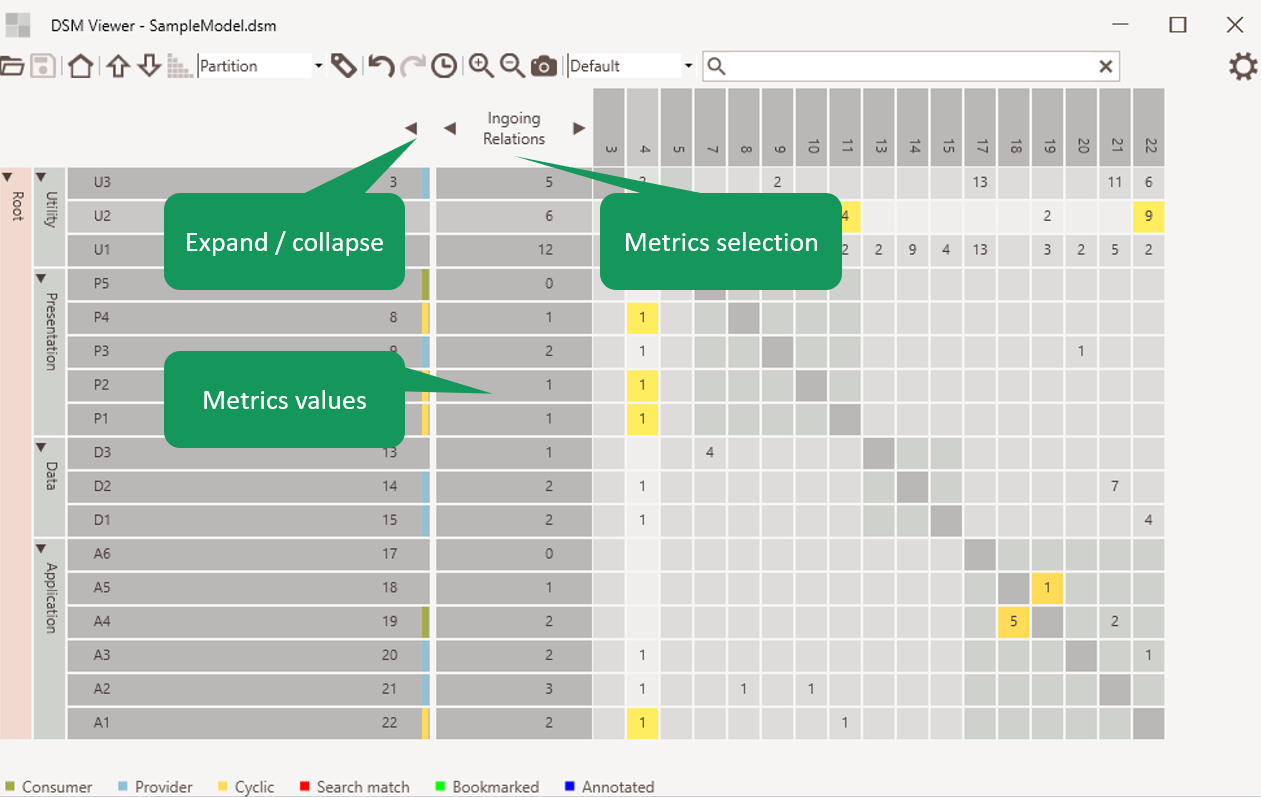
Figure 6: Metrics
Zoom and screenshot
A screenshot can be taken and the zoomlevel can be adjusted.
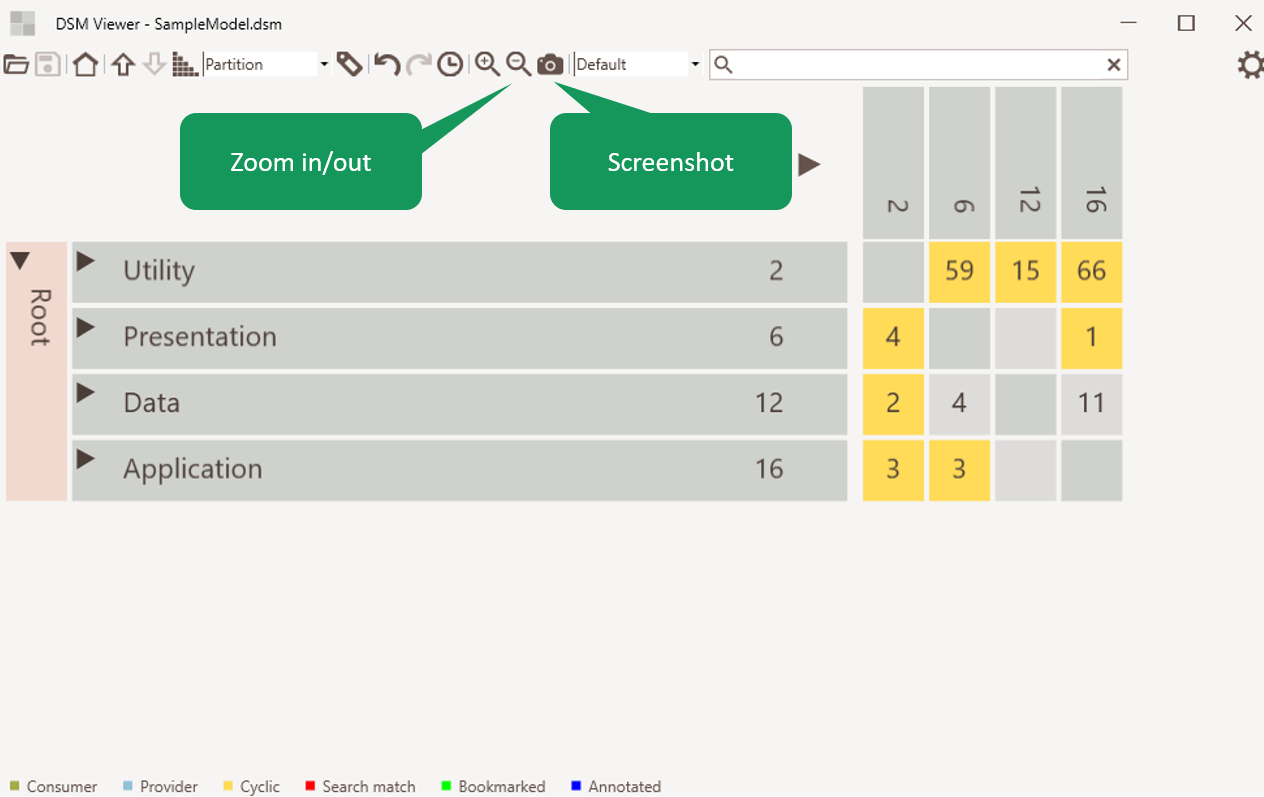
Figure 7: Zoom and screenshot
Model editing
Models can be editing by:
- Move the selected element up or down within the range of its parent.
- Sort children of the selected element. Partioning and alphabetical sorting algorithms are available.
- Create, edit, and delete elements
- Create, edit, and delete relations
- Saving the changes in the DSM file
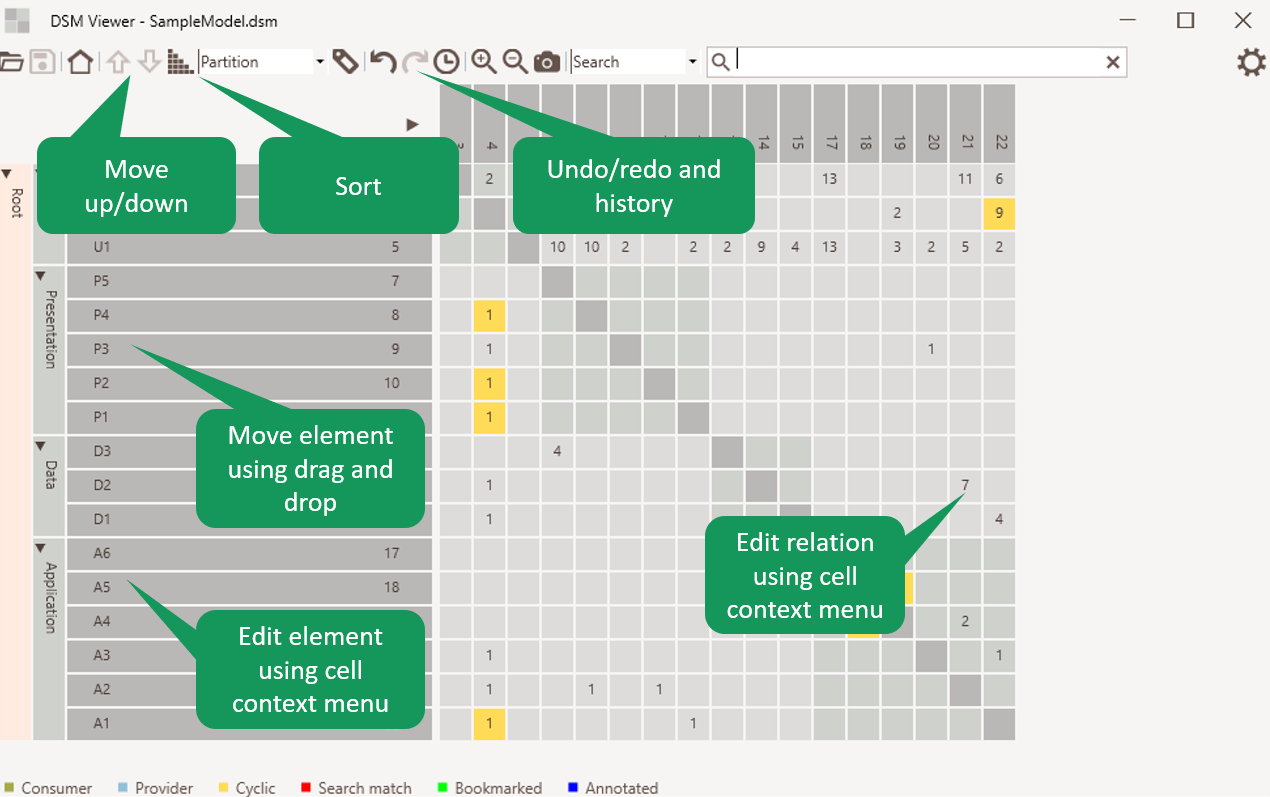
Figure 8: Model editing
Element Context Menu
The context menu of an element allow:
- Moving, creating, editing and deleting elements.
- Add or remove bookmark or annotation.
- Showing a list of consumers or providers of the selected element.
- Showing a list of relations of the selected element.
- Showing a detailed matrix of the selected element.
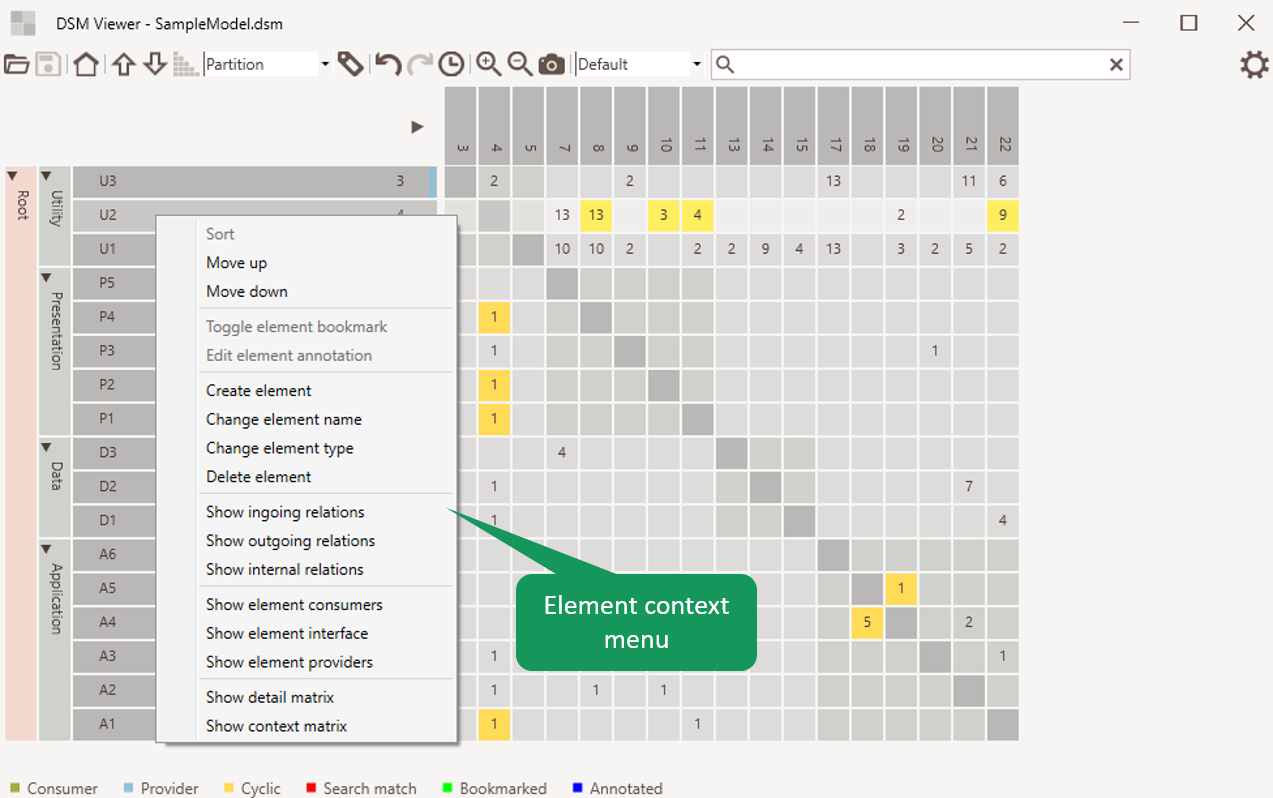
Figure 9: Element Context Menu
Relation Context Menu
The context menu of an relation allow:
- Creating, editing and deleting relations.
- Showing a list of consumers or providers of the selected cell.
- Showing a list of relations of the selected cell.
- Showing a detailed matrix of the selected cell.
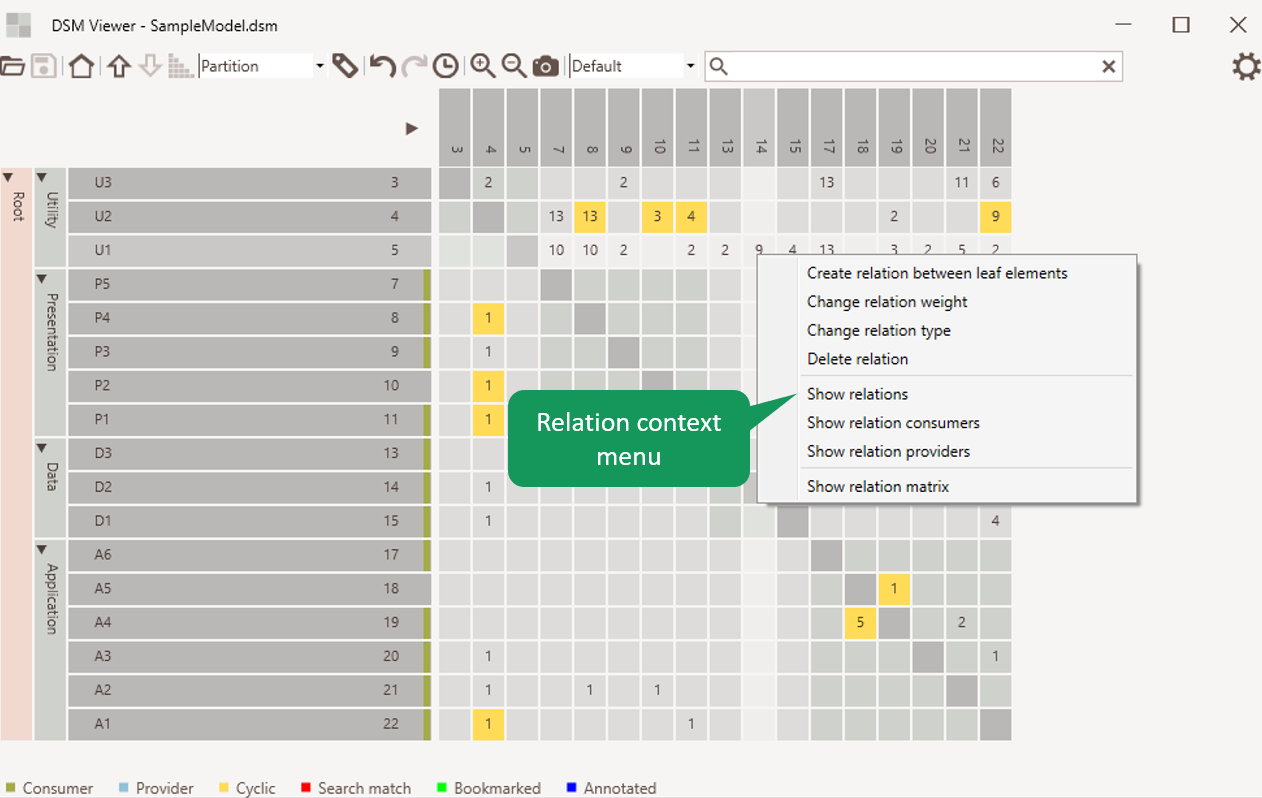
Figure 10: Relation Context Menu